TSNE approach to player clustering
TSNE was in fact my first idea for this task, because I wanted to reduce the dimensility of dataset, in which majority of attributes must be somehow correlated with each other. The first time I saw example of TSNE usage was on r-bloggers.com in pokemon visualition post, written by Joshua Kunst.
So I basically treated NBA players as they were Pokemon…
Actually It enabled me to reduce number of dimensions from 25 to 2 and therefore visualize all players on one chart. With over 470 players I learnt quickly that I should start from dividing them by positions they play. I also found some patterns which I tried to follow in further analysis. So it was not just an art for art’s sake.
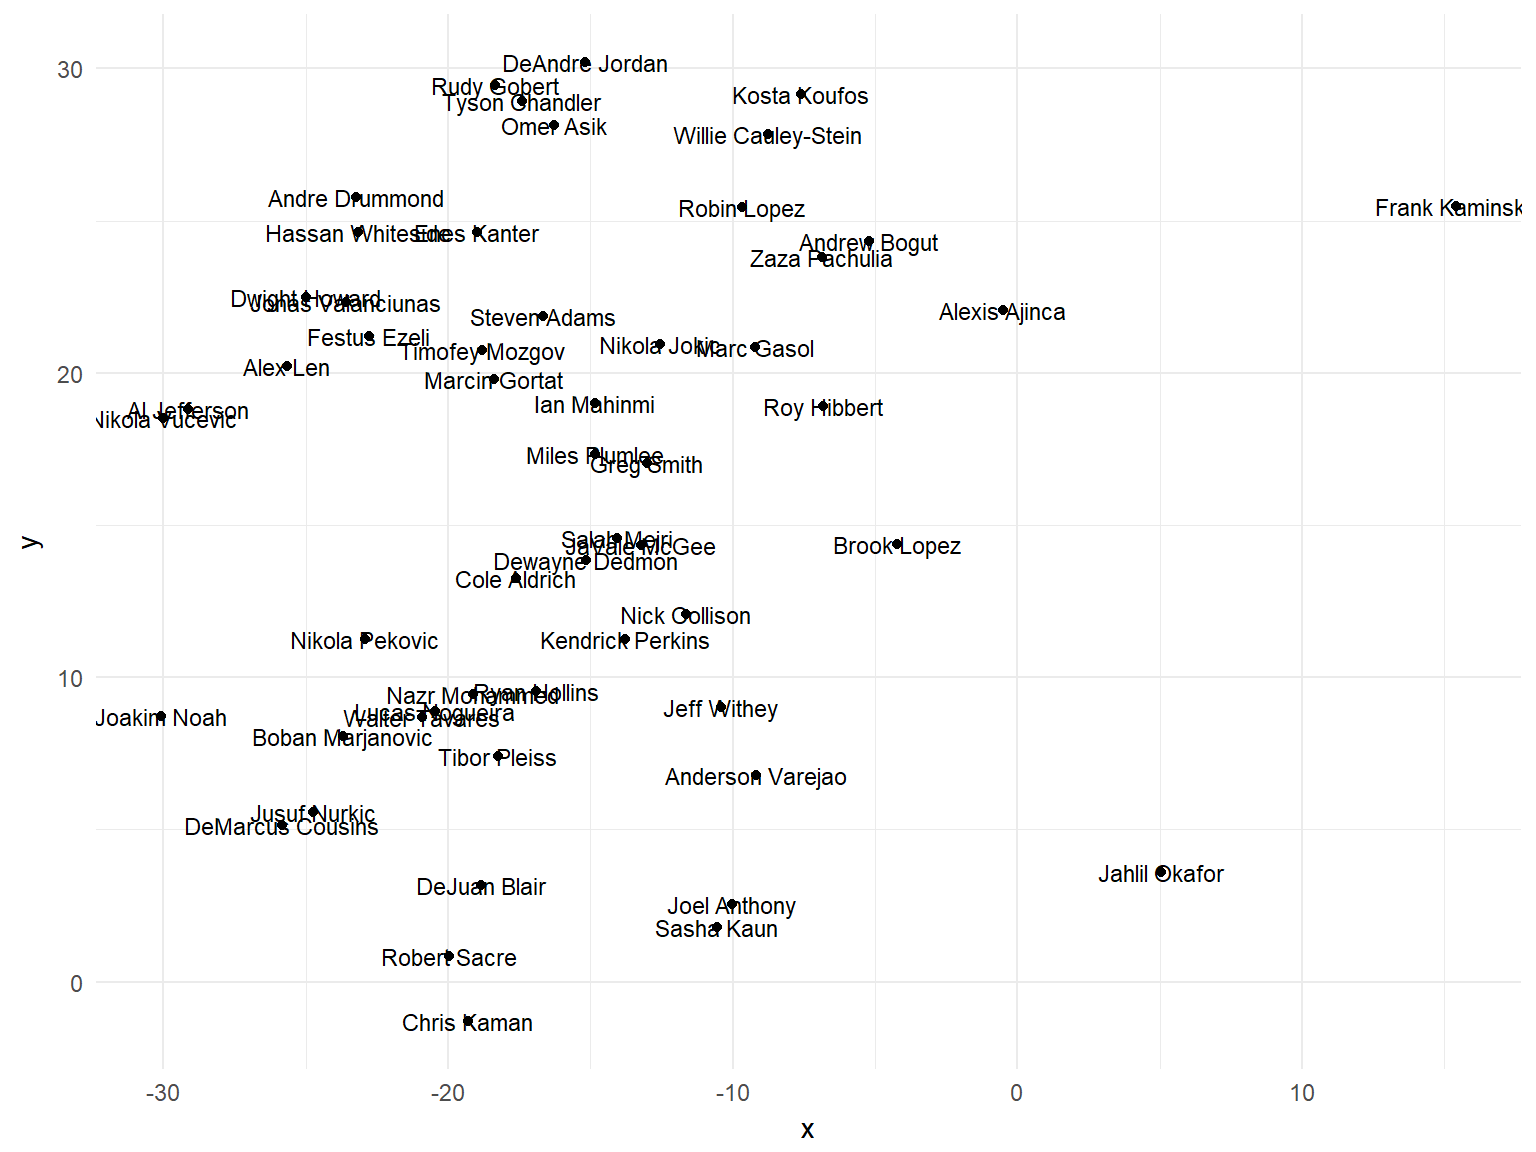
Centers
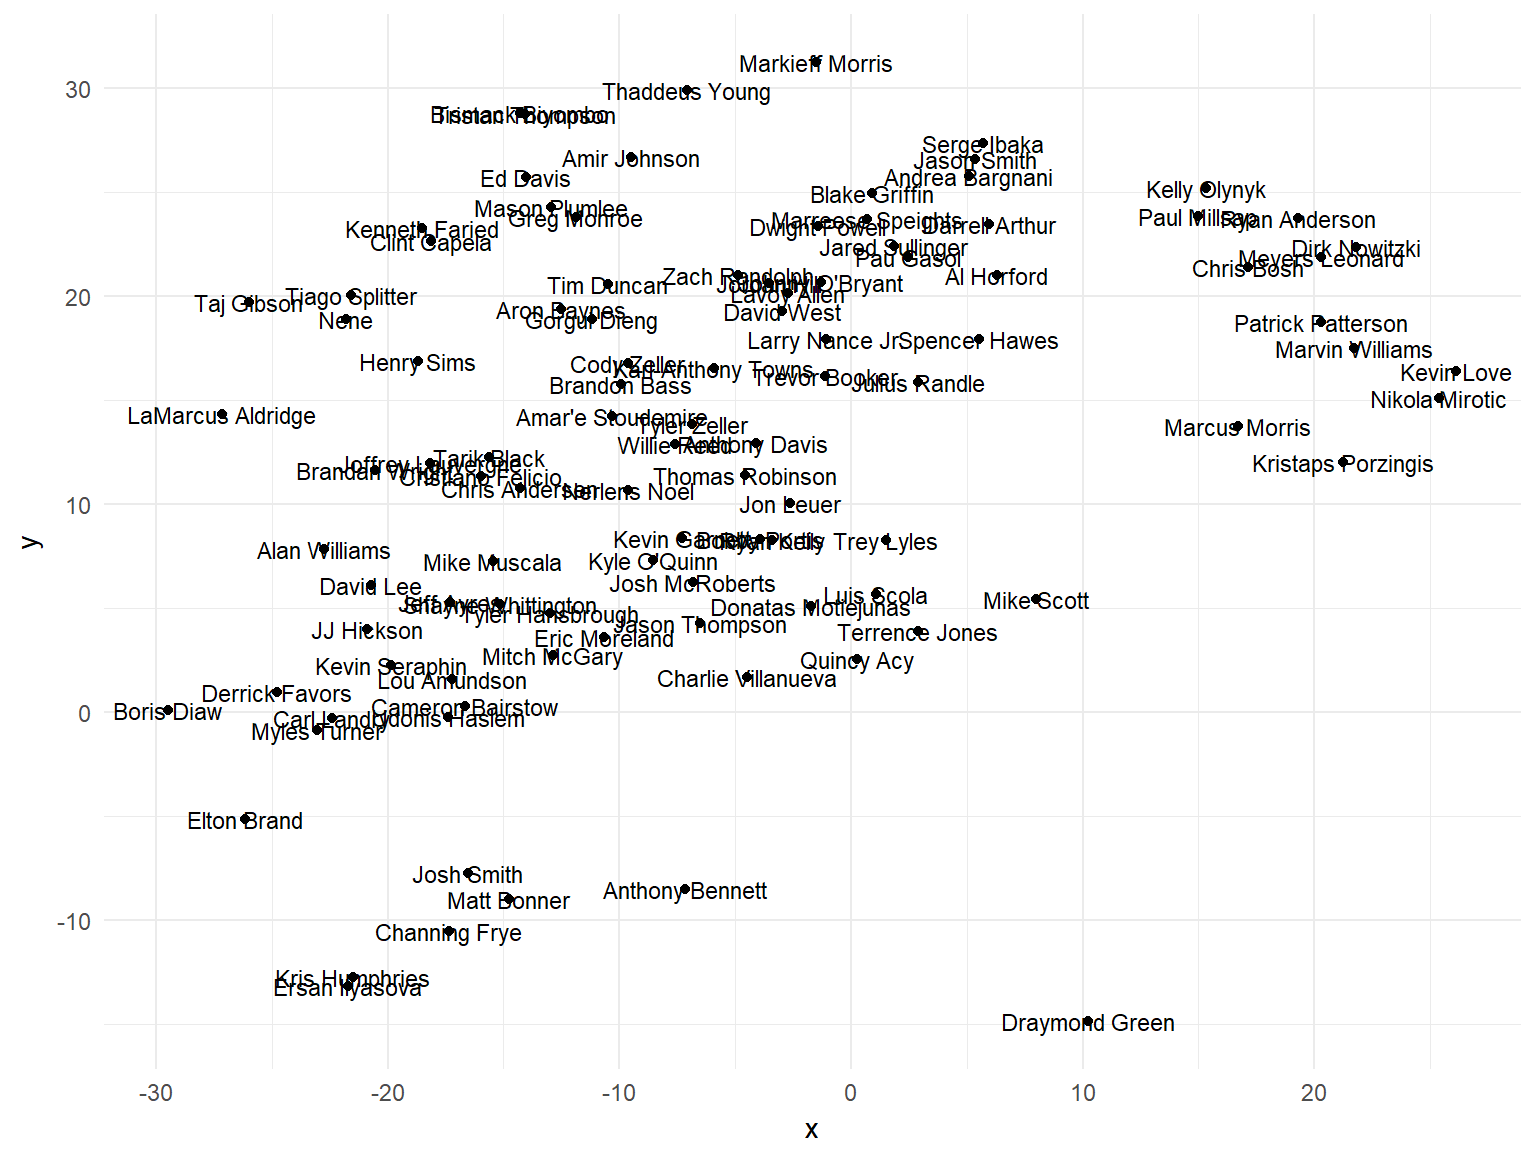
Power forwards
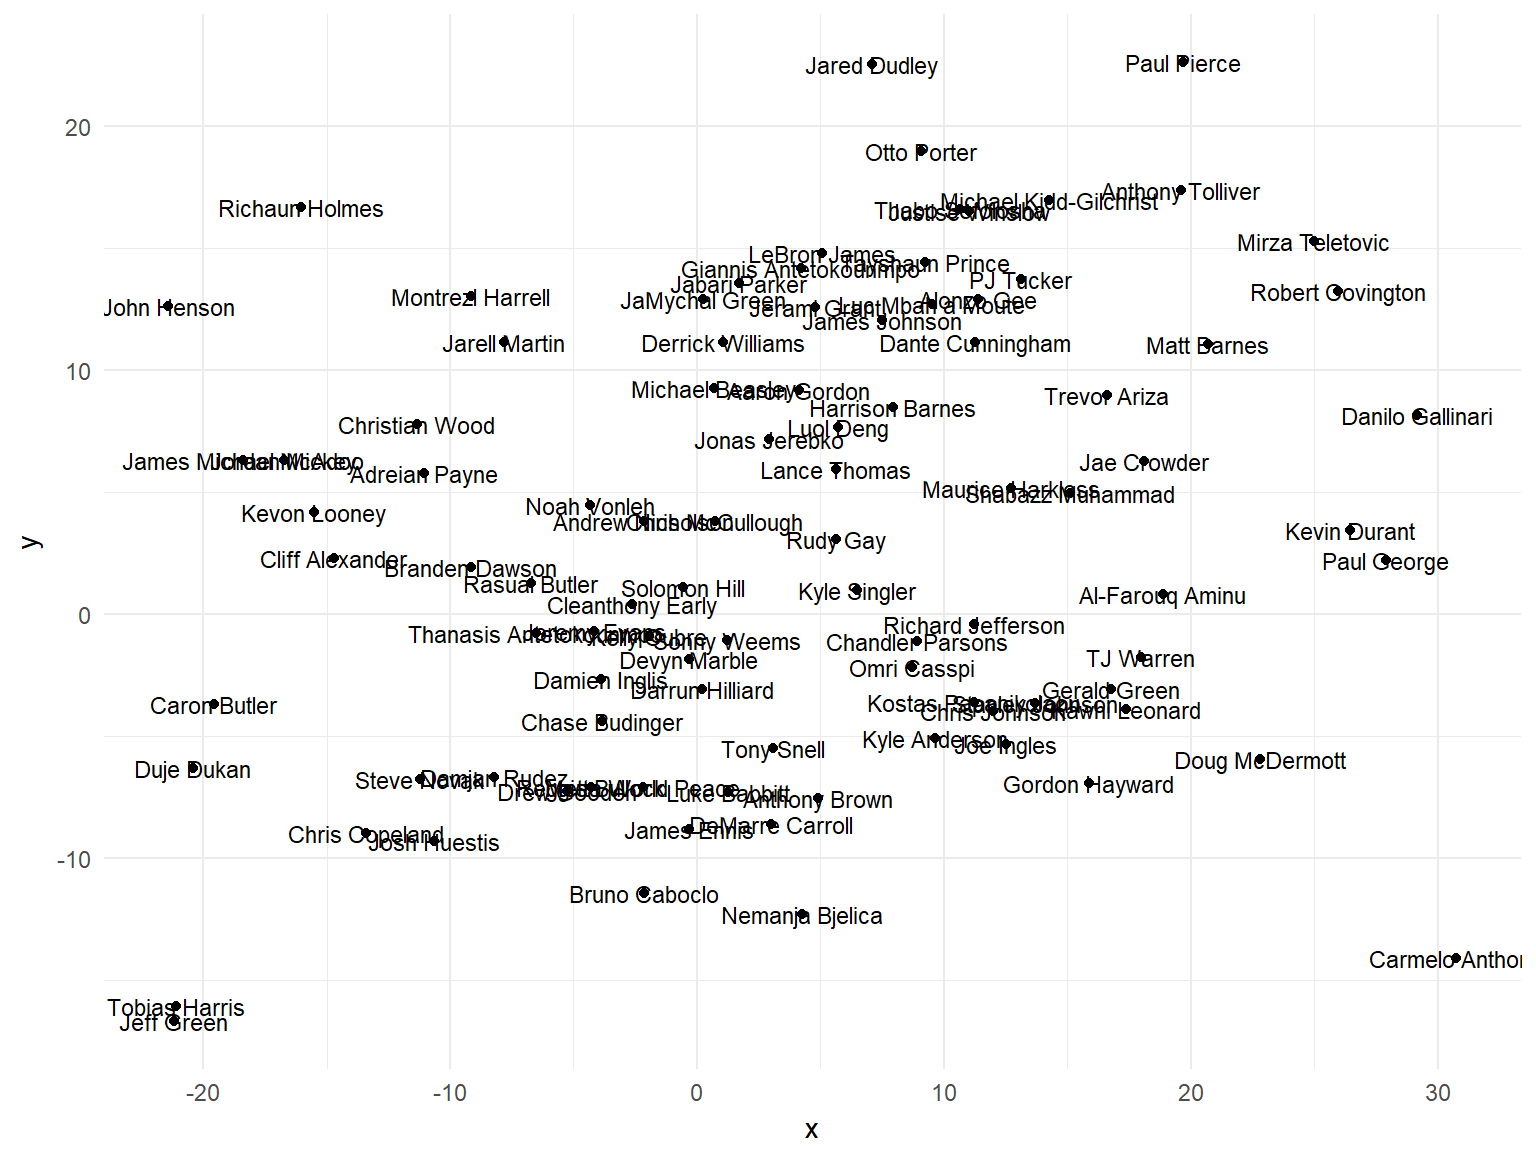
Forwards
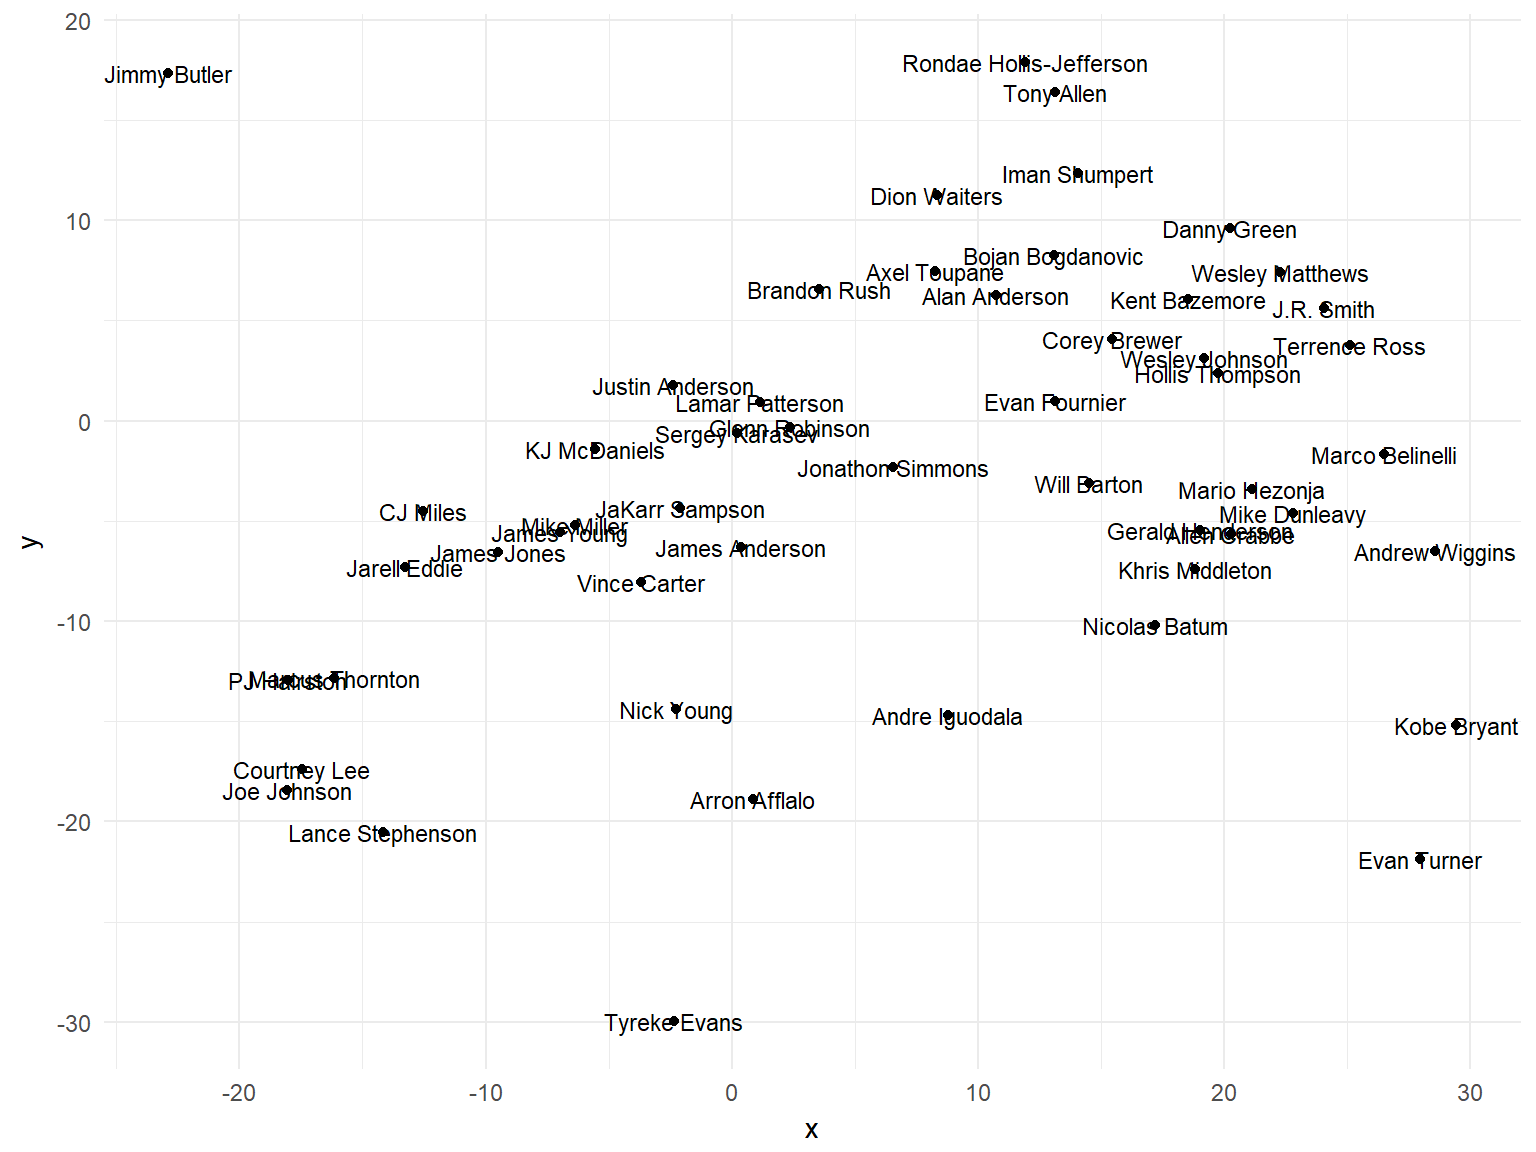
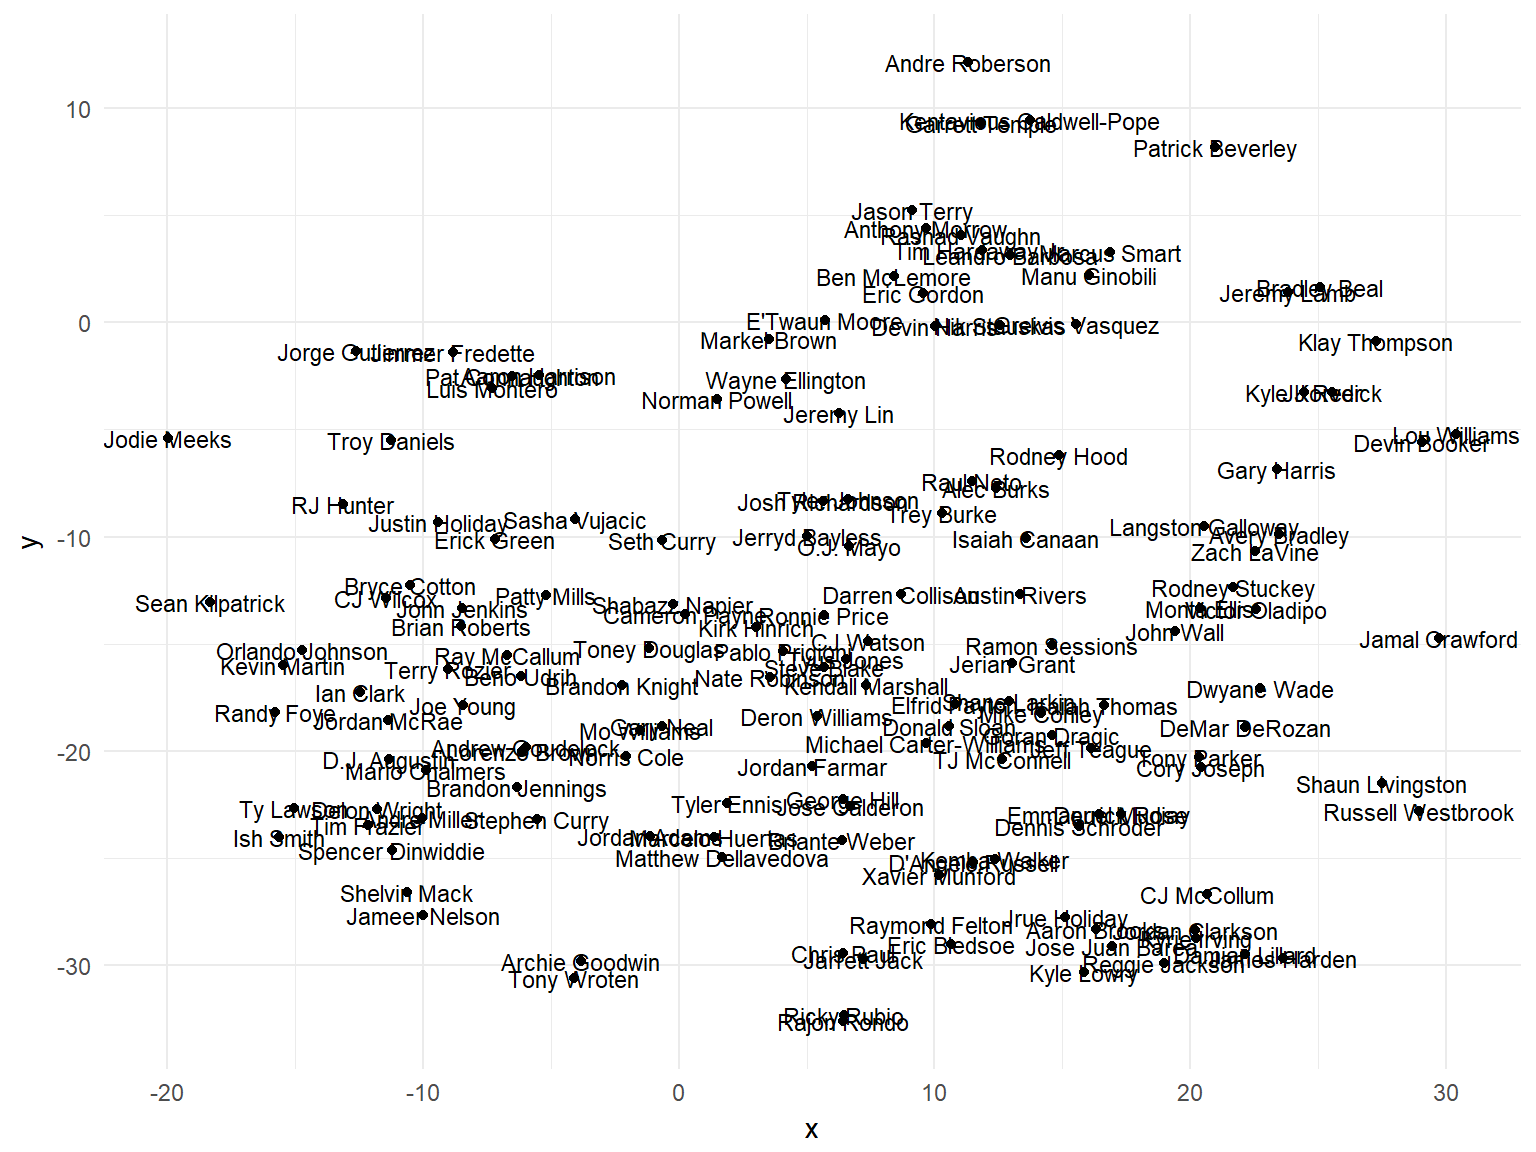
Wingmans
Guards
All in all it is quite useful method to visualize close observations and outliers, on which I can build further analysis. Since TSNE does not create clusters in a basic sense, it is time to try out another tool (which happens to be GMM).
Last but not least, it is quite funny how plots confirm some real-life facts:
- Centers: It is significant how far is DeMarcus Cousins from the rest of the field.
- Power Forwards: Draymond Green owns really a different skillset than the rest of the big wings.
- Forwards: Nothing to see here, sadly LeBron James is in the top-centre of the plot.
- Wingmans: Jimmy Butler and Kobe Bryant could not be farther away.
- Guards: Lets go somewhere else