Clustering teams by their defense p1
In the first part I want to simply divide NBA teams by zones from which their opponents are shooting more frequent than from the others. These are not complex clusters that would provide me a little bit of insight if there is any difference between teams. My overall assumption is that better teams would allow less shots from “danger zones” which are Restricted Area and Three Point Line.
There are of course only 30 observations, one for each team, and five variables describing frequency for each zone (Restrcited Area, Paint, Mid-Range, Long-Range, 3Point Line). For such simple data I will use as simple methods which are famous and popular k-means and k-medoids.
Data
I created five standarized variables based on original frequency columns. Bear in mind, that those percentages do not include garbage time, which I consider as unnecessary noise. We can call it like “significant game time percentage” or something similar. Final dataset looks like this:
| team | lr.f | mr.f | pa.f | ra.f | tr.f | lr.fnorm | mr.fnorm | pa.fnorm | ra.fnorm | tr.fnorm | w | |
|---|---|---|---|---|---|---|---|---|---|---|---|---|
| 1 | Atlanta Hawks | 17.40 | 13.67 | 7.60 | 32.97 | 28.36 | 0.8830860 | -0.0434870 | -1.7813960 | 0.2897754 | 0.0142405 | 48 |
| 2 | Boston Celtics | 16.09 | 14.10 | 10.29 | 32.10 | 27.43 | -0.0729823 | 0.2517666 | 1.0220100 | -0.1864927 | -0.3752787 | 48 |
| 3 | Brooklyn Nets | 14.68 | 11.46 | 8.52 | 35.23 | 30.11 | -1.1020329 | -1.5609526 | -0.8226103 | 1.5269776 | 0.7472066 | 21 |
Outliers
Since k-means can be really prone to outliers I like to use DBSCAN algorithm to find outliers and exclude them from final clustering. I found it highly beneficial for the quality of final results. I set minPts = 1 from “number of variables + 1” rule.
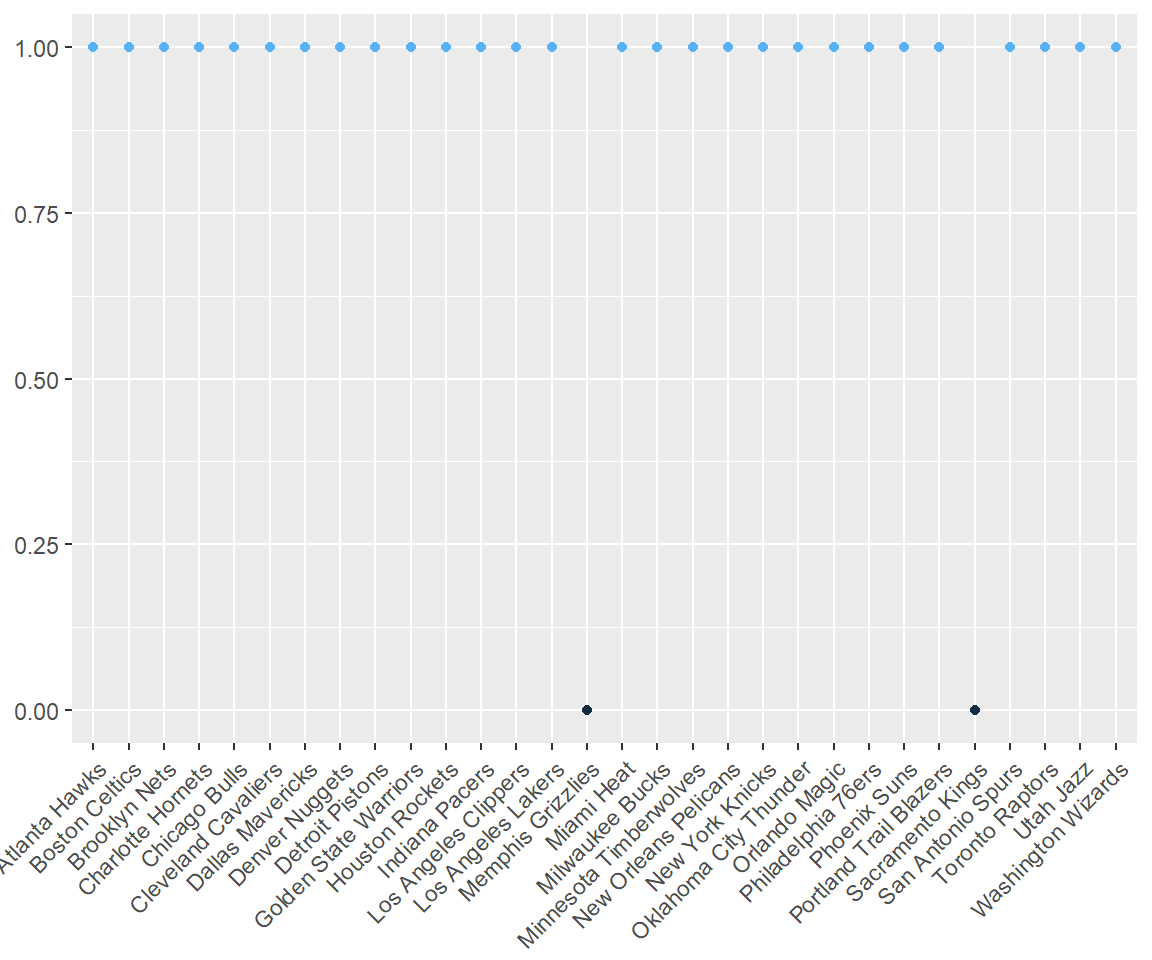
So in this case my outliers will be Memphis Grizzlies and Sacramento Kings, those teams must be unlike anything else. We knew that before about Kings, didn’t we?
K-means
I set 5 centers for the algorithm, after a bit of trial-and-error searching.
| Clusters k-means | |
|---|---|
| 1 | Brooklyn Nets; Houston Rockets; Los Angeles Lakers; Milwaukee Bucks; Minnesota Timberwolves; Oklahoma City Thunder; Orlando Magic |
| 2 | Boston Celtics; Chicago Bulls; New York Knicks; Philadelphia 76ers; Utah Jazz |
| 3 | Atlanta Hawks; Charlotte Hornets; Denver Nuggets; Indiana Pacers; New Orleans Pelicans |
| 4 | Dallas Mavericks; Los Angeles Clippers; Phoenix Suns; Portland Trail Blazers; Toronto Raptors; Washington Wizards |
| 5 | Cleveland Cavaliers; Detroit Pistons; Golden State Warriors; Miami Heat; San Antonio Spurs |
K-medoids
Although K-medoids algorithm is more robust to outliers I still exclude outliers from the run just to be sure they do not mess up results.
| Clusters k-medoids | |
|---|---|
| 1 | Brooklyn Nets; Denver Nuggets; Houston Rockets; Los Angeles Lakers; Milwaukee Bucks; Minnesota Timberwolves; Oklahoma City Thunder; Orlando Magic |
| 2 | Boston Celtics; New York Knicks; Philadelphia 76ers; Phoenix Suns; Toronto Raptors; Utah Jazz |
| 3 | Atlanta Hawks; Charlotte Hornets; Dallas Mavericks; Indiana Pacers; New Orleans Pelicans |
| 4 | Chicago Bulls; Los Angeles Clippers; Portland Trail Blazers; Washington Wizards |
| 5 | Cleveland Cavaliers; Detroit Pistons; Golden State Warriors; Miami Heat; San Antonio Spurs |
Insights
It is nice to to see that some patterns and even clusters are similar across both methods… and infinitive number of small polishes and adjustments
- Pistons, Cavaliers, Warriors, Heat and Spurs are rock solid within their group
- …So are Nets, Rockets, Lakers, Bucks, Wolves, Thunder and Magic
- ….Aaaaaand Hornets, Hawks, Pacers and Pelicans
- Also Blazers, Wizards and Clippers seem to work together.
- Not to forget of Celtics, Knicks and Sixers.
On the other hand teams like Mavericks, Nuggets, Bulls, Jazz, Suns, Raptors seem to be standing on the borders between two clusters. Their position strongly depend on the randomness of each instance of an algorithm.
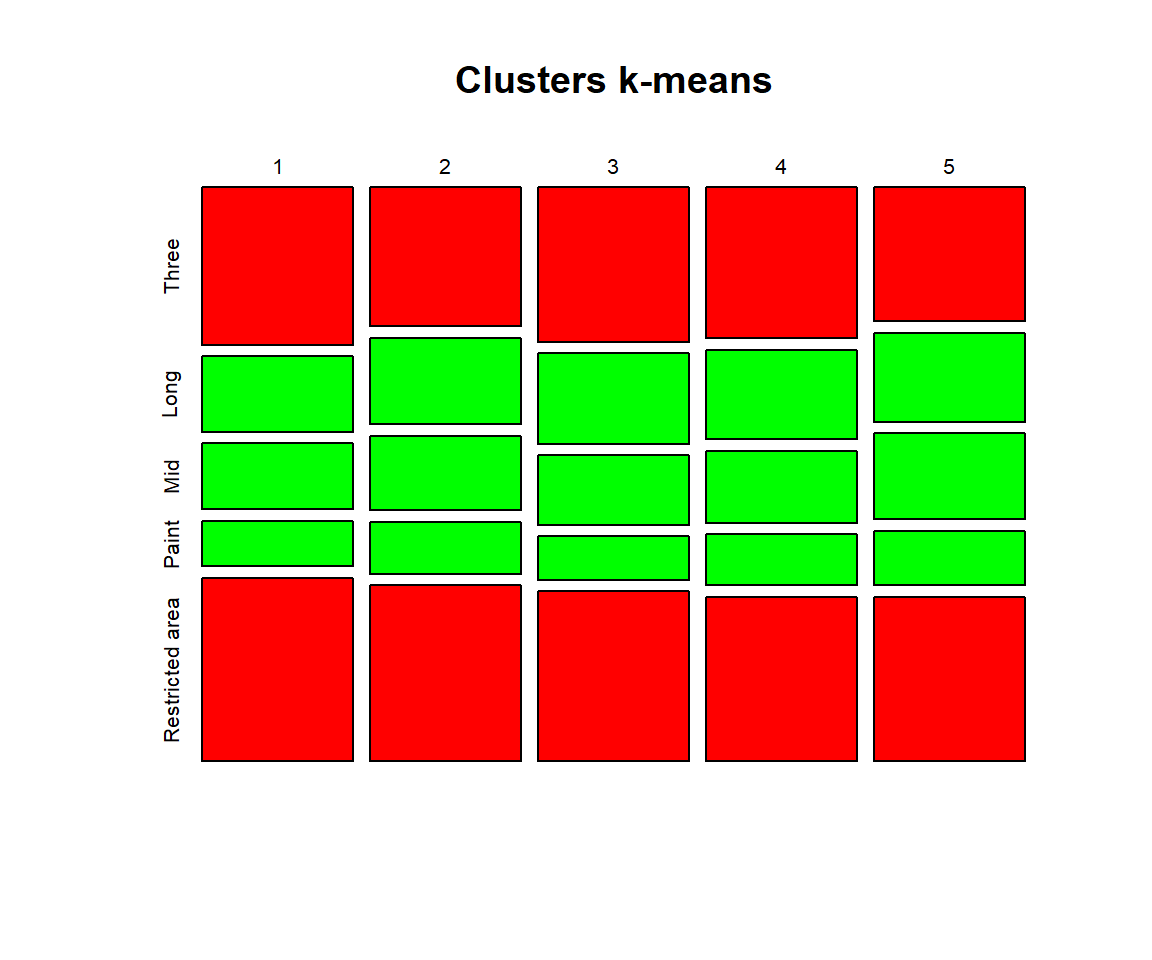
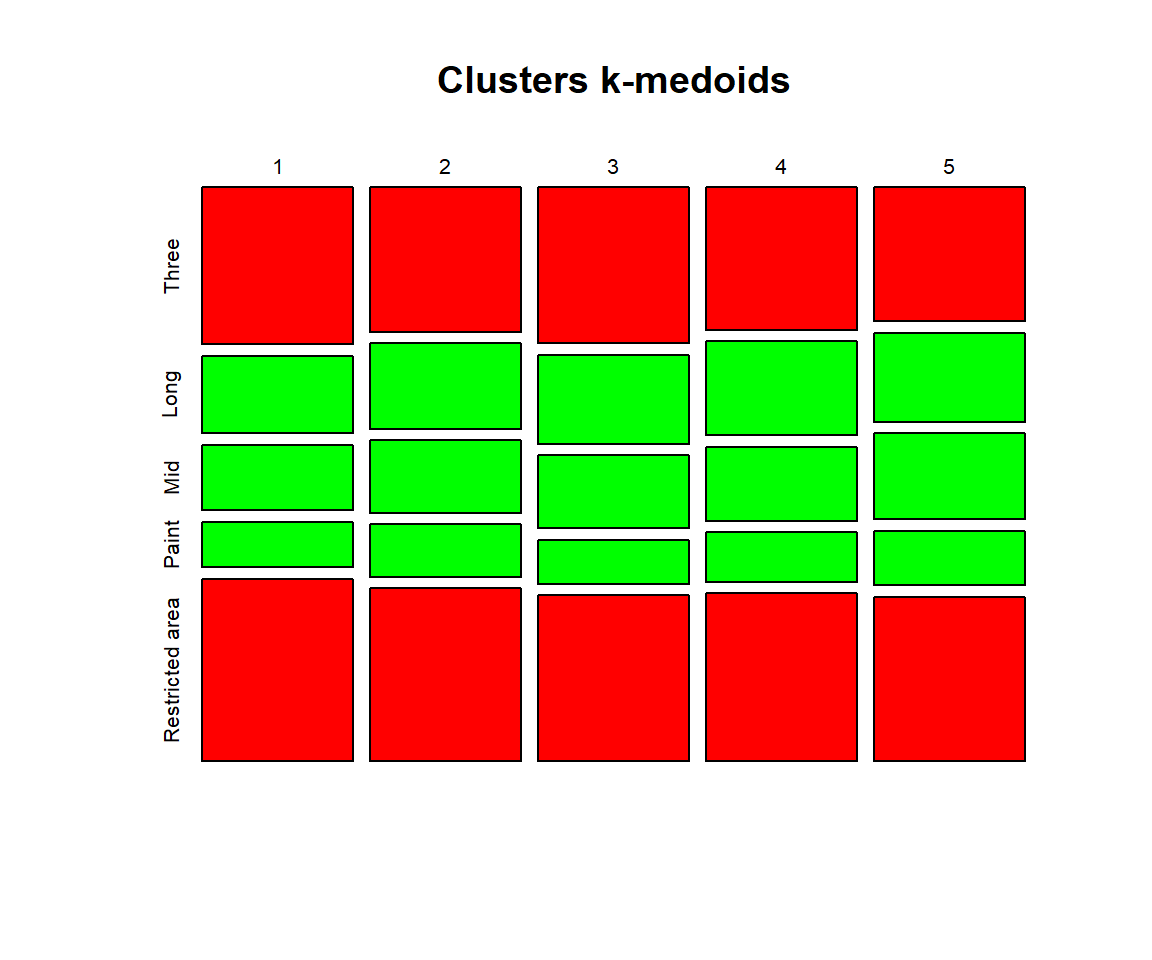
Answer
Do better teams really allow their opponents to shoot less from the Three Point Line and Restricted Area? Mosaic plots visualize the answer almost clearly. After sorting clusters by their average number of wins during regular season, we can see the slight trend of decreasing frequency of Restricted Area and Three Point shots. In fact there is huge difference between distribution of shots between the first and the last cluster. For me it is enough to confirm my assumptions.