Clustering players by offensive style of play
My main goal of NBA analysis has always been and probably always will be trying to predict how any player would play against any team on any particular day of regular season. I am sure that building such a model would not be succesful without getting to know and then classyfing the players themselves before taking the next step. The main objective of this particular clustering is to find differences in style of play on the offensive end of the floor between NBA players.
I also thought about trying to teach machine learning models without clustering the players. It could be possible since there is somehow fixed number of players during regular season, but teaching the models data for every single player against every particular team without grouping would easily lead to overfitting.
Data
My set of attributes consists of absolute number of shots from each area (Restricted Area, Paint, Mid Range, Long Range and Three Point Line), number of touches, assists, passes, rebounds and minutes per game. There is also a factor column with position each player plays on. Next group of attributes gathers information about playtypes - for example catch and shoot, pull-up, post up, spot up, cut and so on. All numeric variables were normalized.
After many tries I realized that distinguishing players by their positions in the first step is crucial for preparing proper and effective model. So, there will be five of them:
- Centers (pretty obvious)
- Power Forwards (between forward and center, sometimes include smaller centers)
- Forwards (Lebron-likes)
- Wingmans (between guard and forward)
- Guards (both point guards and shooting guards)
GMM algorthm
Choosing an algorithm took me much more time I expected but at the end I think it was worth it. I started with hierarchical clustering because it worked for me before and I find it really effective method. But I noticed that for that many different observations hard-clustering is a risky method, so I switched to soft clusters. I also did not like the visualization of over 450 players in one dendrogram.
I tried out DBSCAN and TSNE algorithms but did not come up with anything useful for that case. You can take a look at the results and descriptions by clicking on the respective tabs.
Finally I came across Gaussian Mixture Models algorithm and after a bit of reasearching, a couple of chapters from different books and an inevitable youtube lecture I learned enough to apply it here with fair level of confidence.
In short, Mclust() function from mclust package is testing all possible models on a dataset and then chooses the one with the smallest Bayesian Information Criteria. In the next step, the chosen one is applied on data.
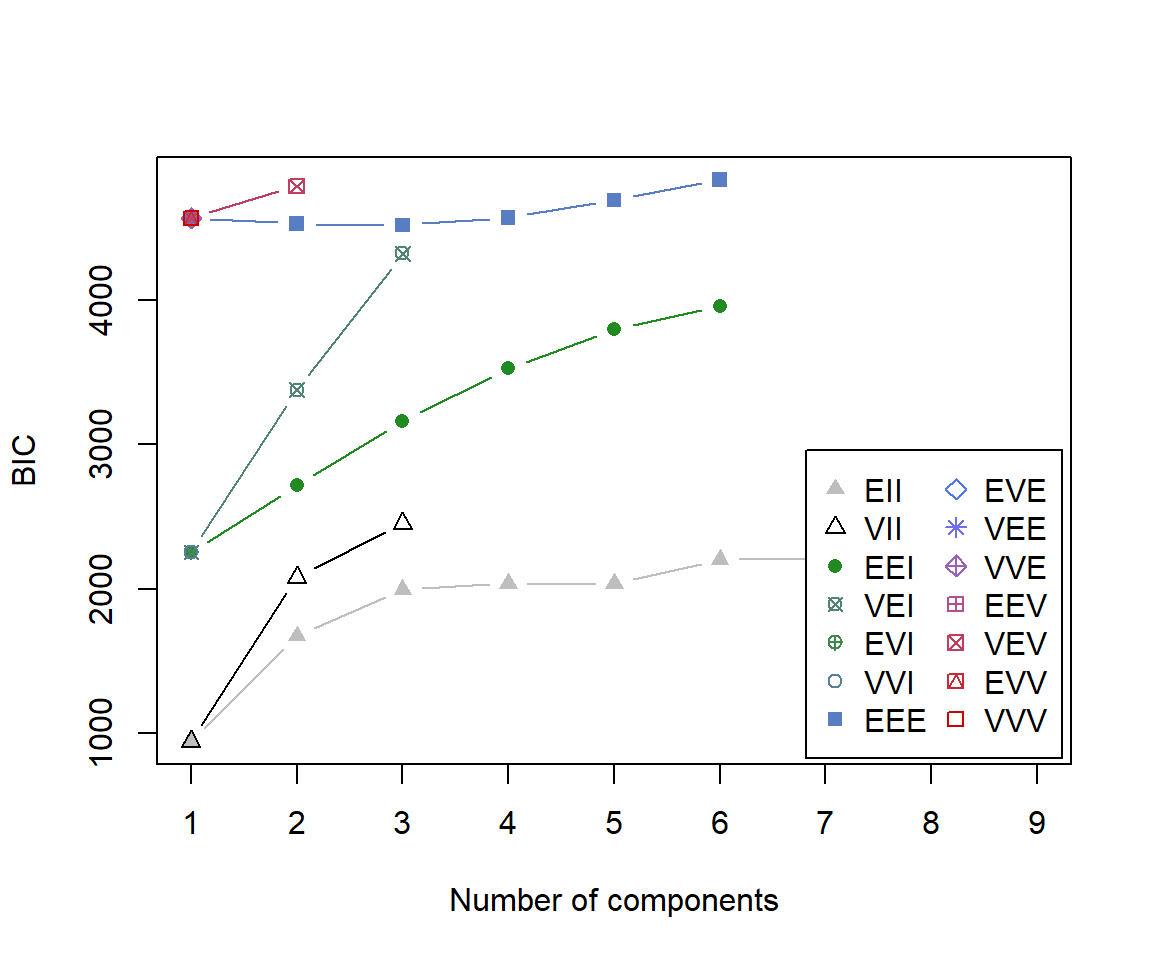
## Best BIC values:
##             EEE,6      VEV,2     EEE,5
## BIC      4832.768 4788.28953 4692.1215
## BIC diff    0.000  -44.47877 -140.6468
In soft clustering observations are not permanently assigned to any of clusters, but instead the algorithm calculates the likelihoods of belonging to each group for each of the observations. Player is then allocated to the group corresponding to the highest probability.
The goal
I do not want to focus only on shooting zones, but also on number of passes, rebounds, touches and minutes, because my objective is to determine the role of a player when he is on the court. That is why I put rarely playing players in different clusters - more often than not they have no impact on the final result.
Centers
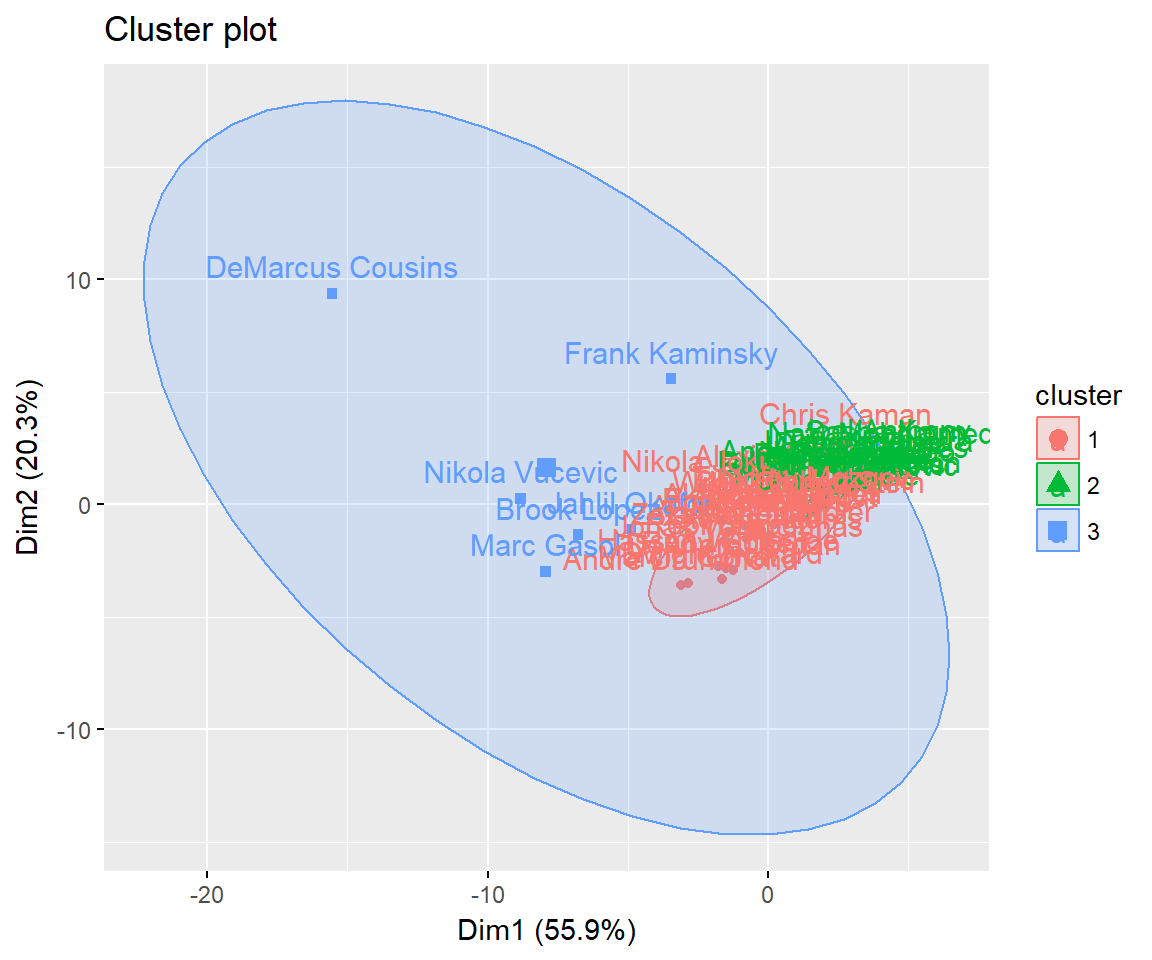
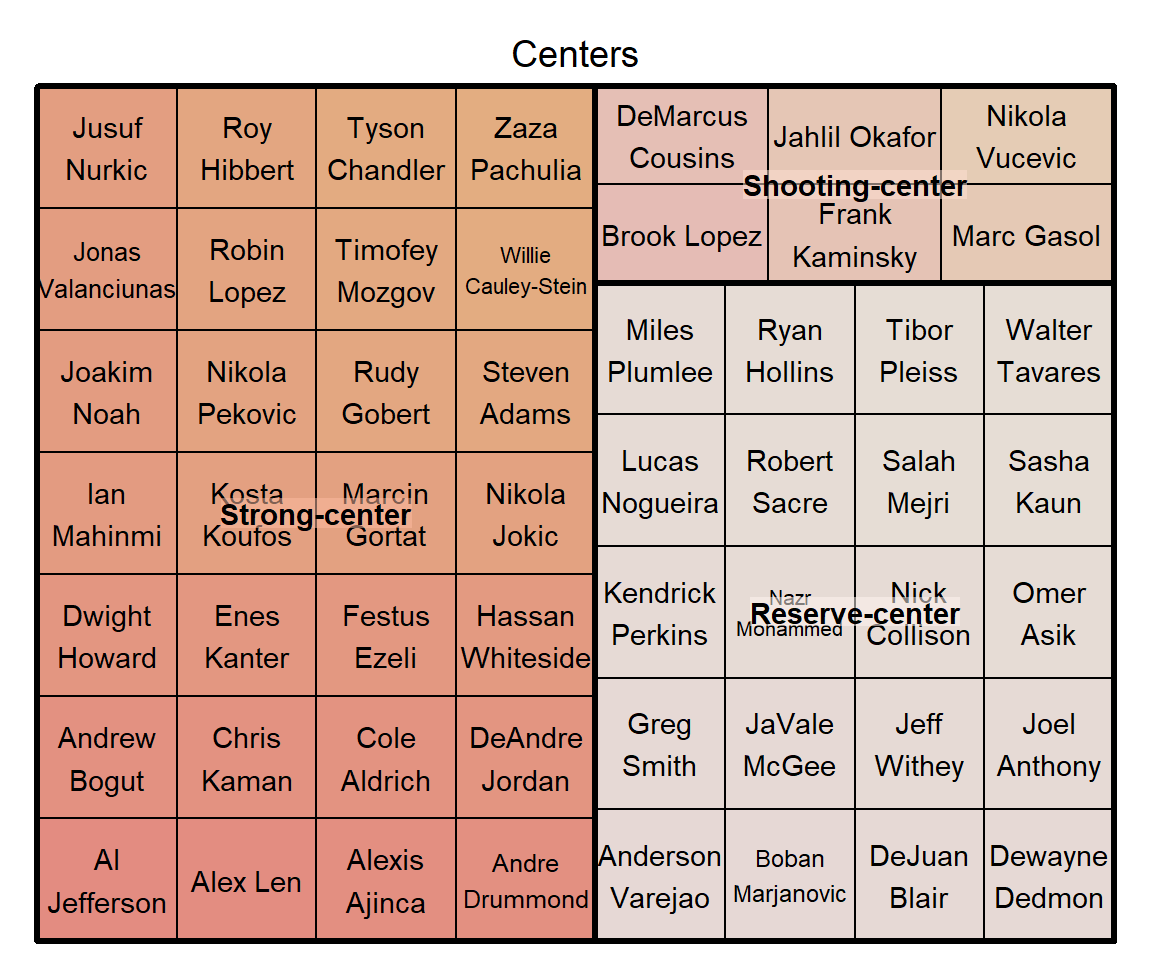
As you can see, there are 3 clusters - one with centers who can effectively score from high-post and even beyond the arc, second one with power centers who can dominate the paint and the last one with deep bench players, who play mostly during garbage time.
After a chunk of not-so-pretty code I got final groups:
Power forwards
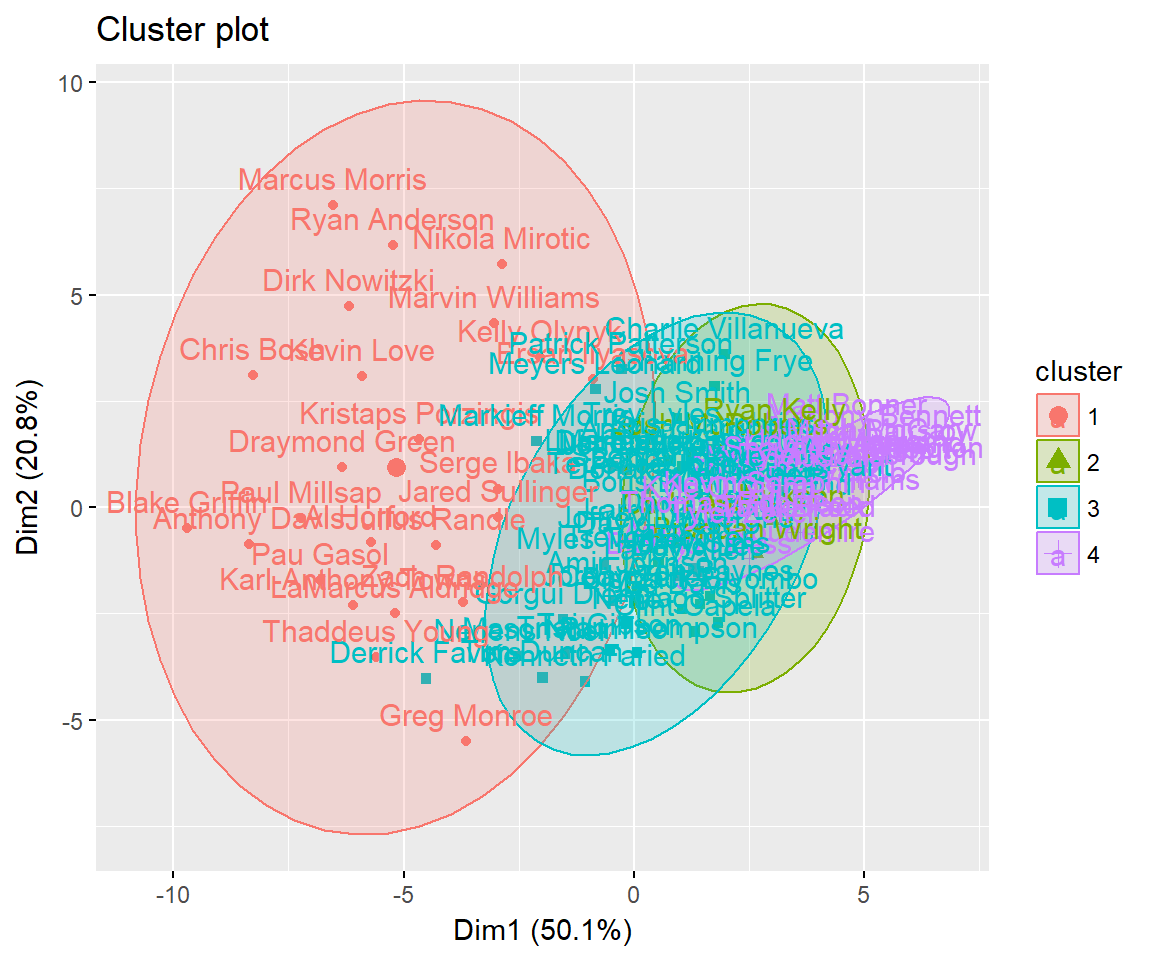
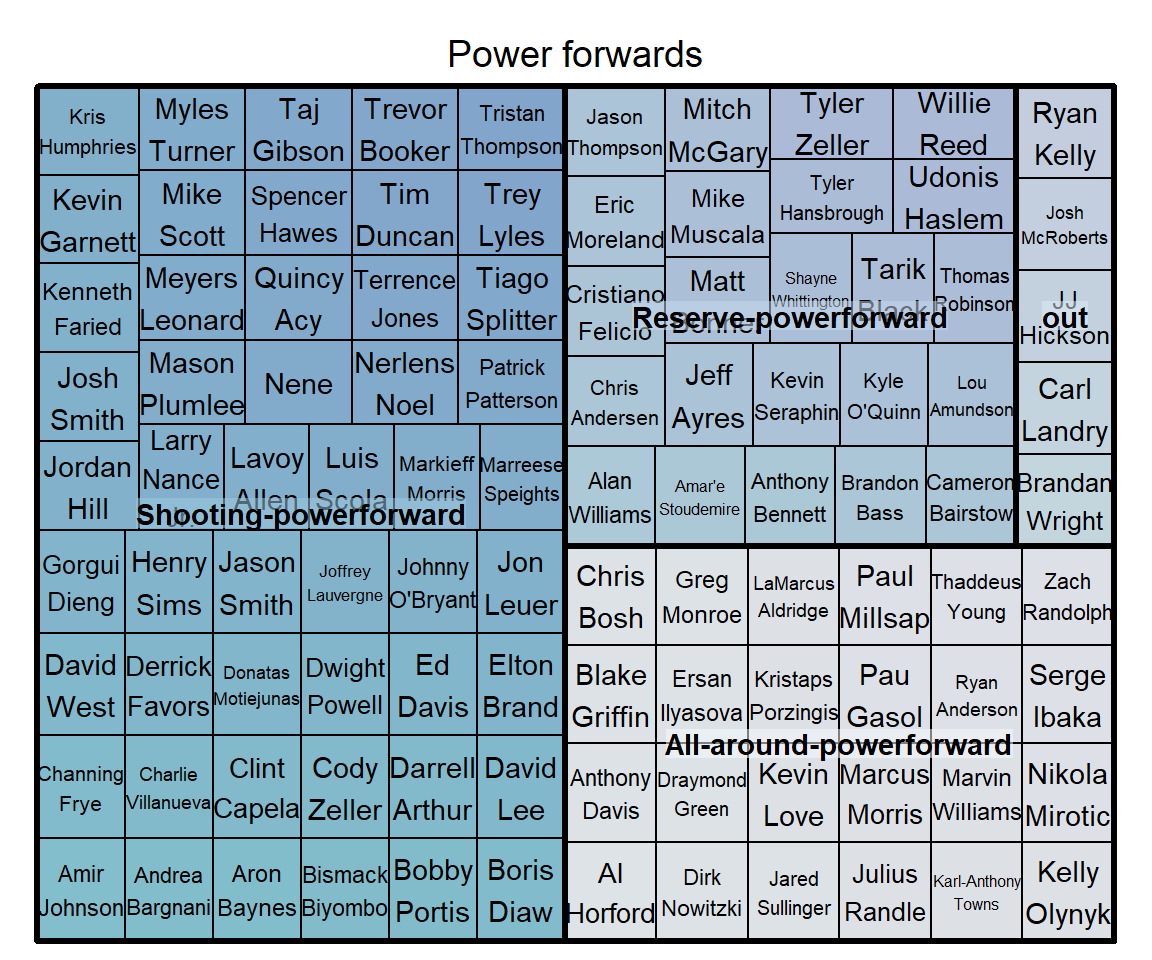
Within powerforward position I found the most differing players. There are rebounding machines like Kenneth Faried or pure shooters like Ryan Anderson. It was quite easy to draw a line between those groups. There power forwards who can do almost everything on the floor, then mostly-shooters, then paint-animals and then deep reserves.
Forwards
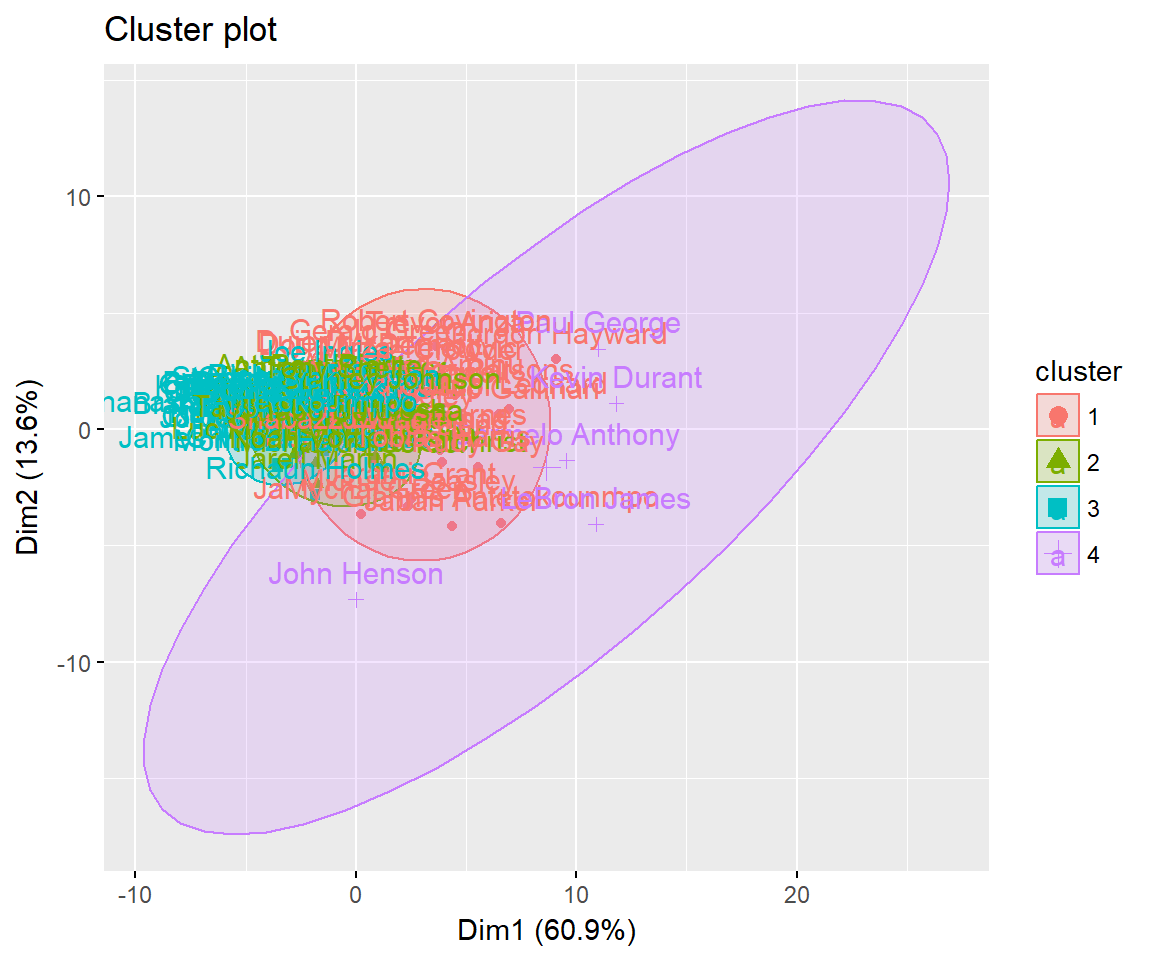
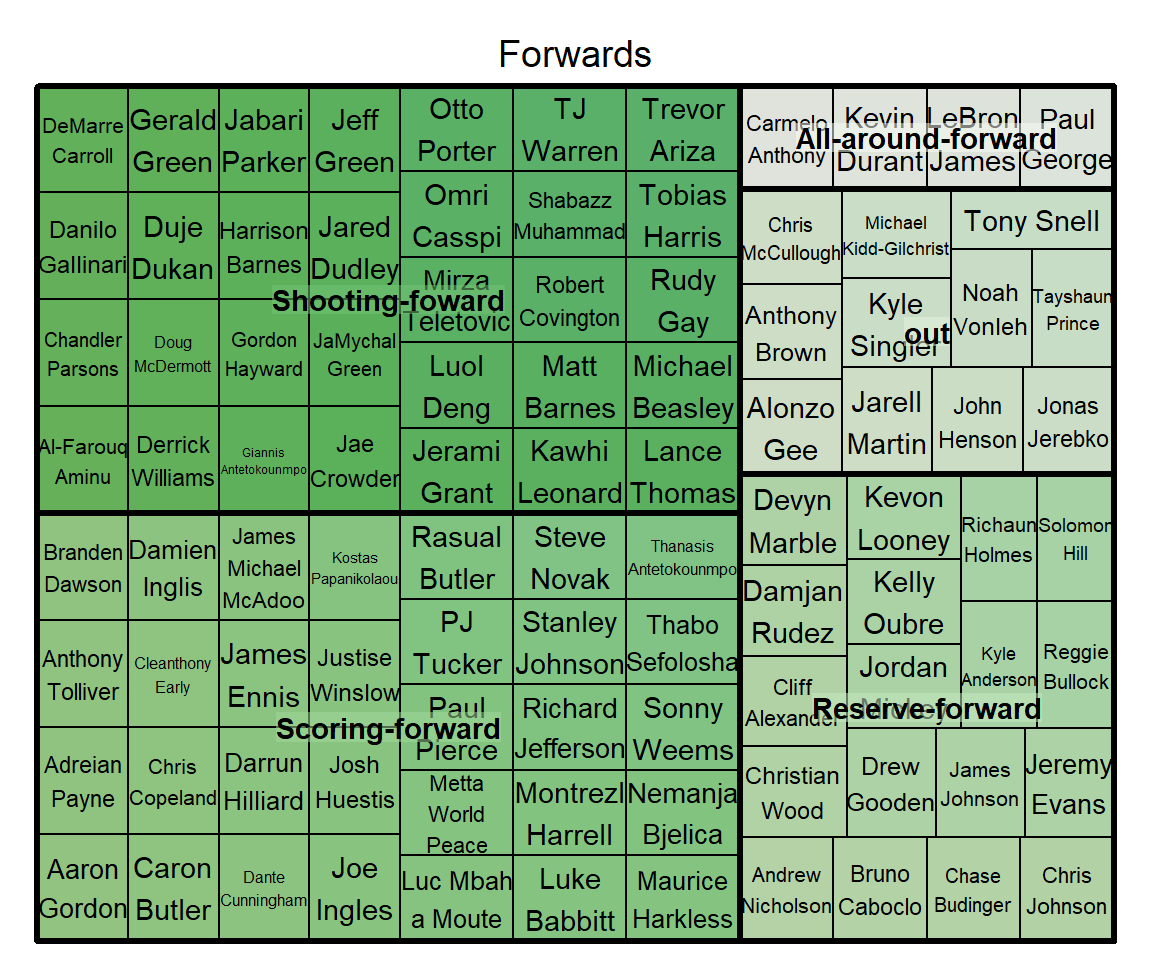
Forwards are pretty straightforward - there are overall point-forwards like LeBron, Melo and KD, then players who rely mostly on their outside shooting and then scorers who actually can’t rely on their shooting behind the arc, but are talented offensively in other ways.
Wings
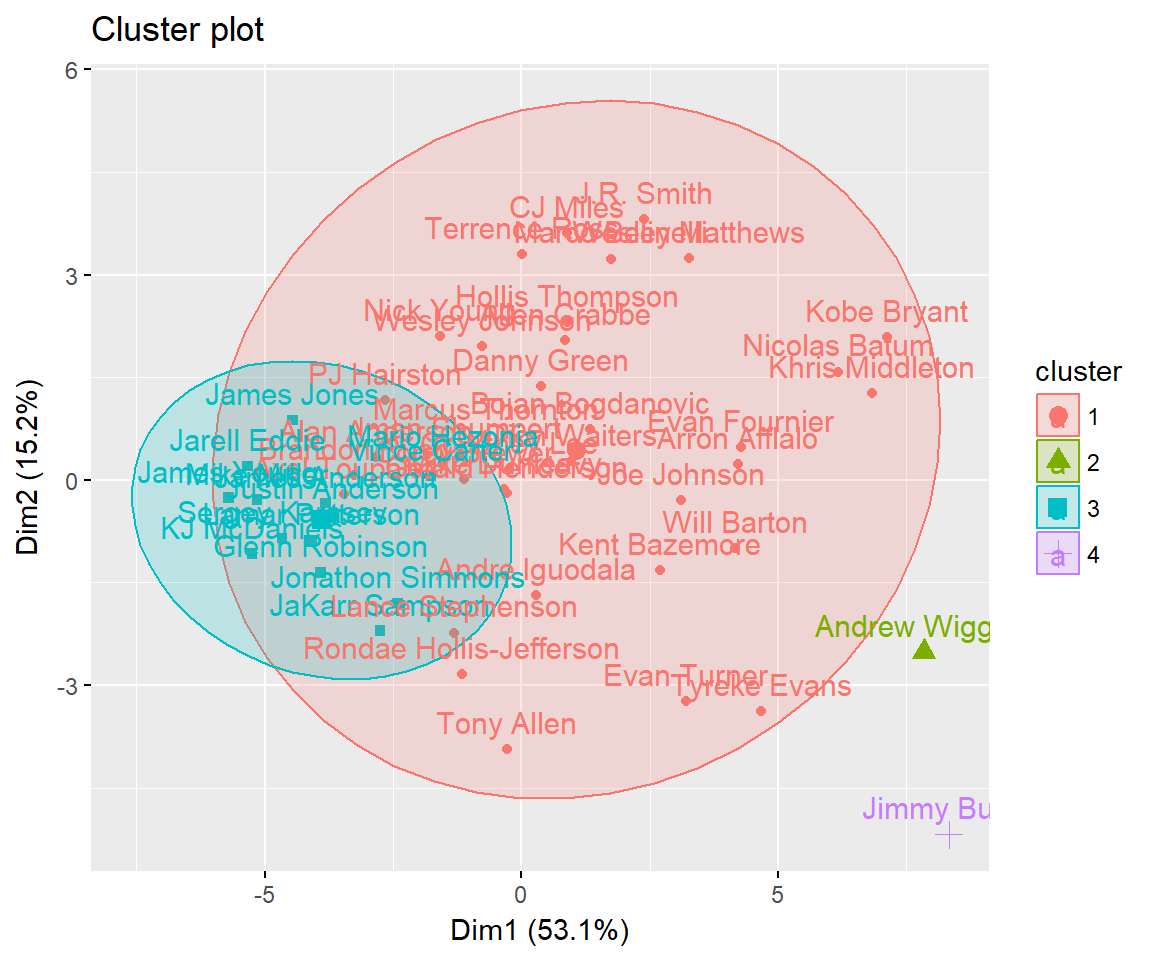
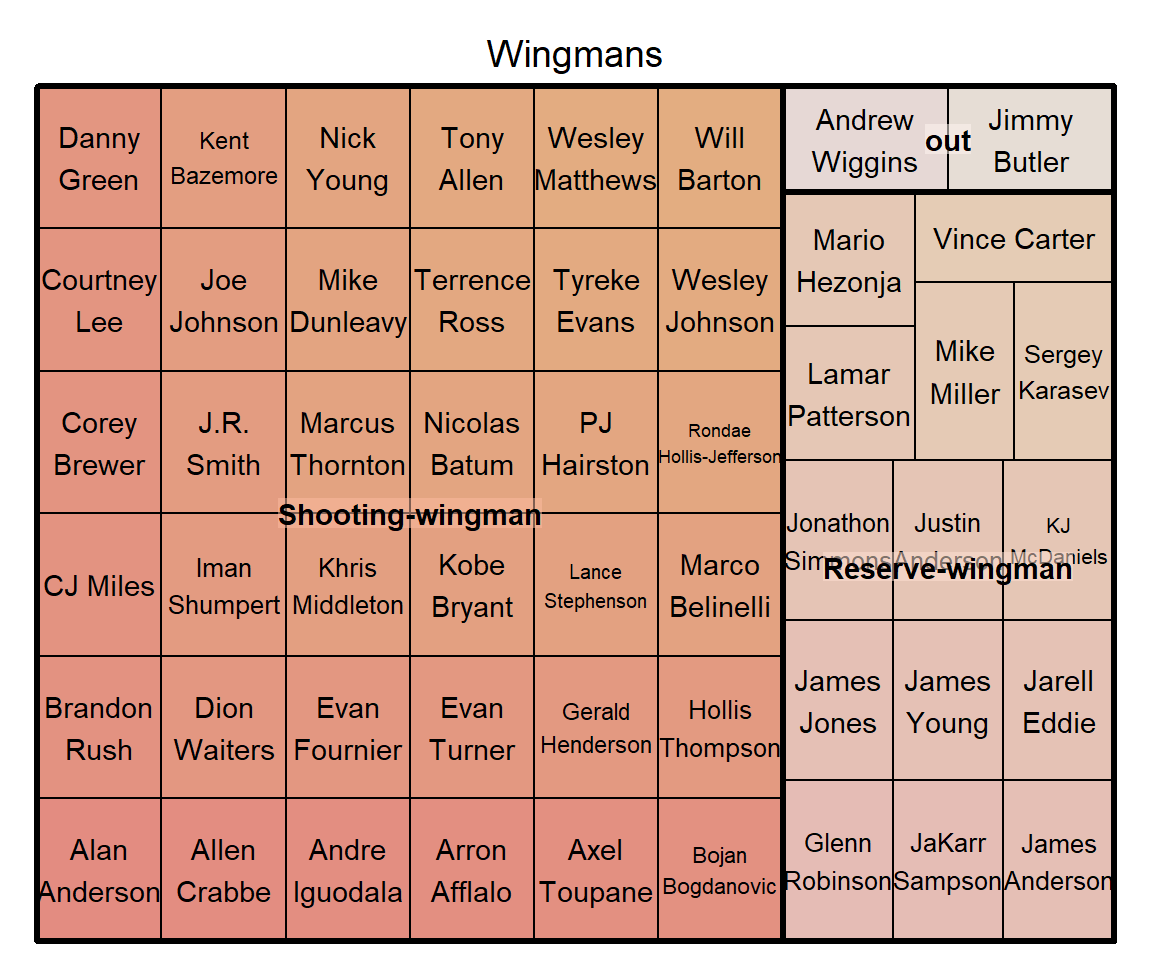
Wingmans are floating between small forward and shooting guard position. They may have different athletic abilities, but there are a lot of simmilar attributes in their offence. Basically all of them are skilled offensive players, and the main difference is if they can score from any area of the floor or just belong to 3 point line.
Guards
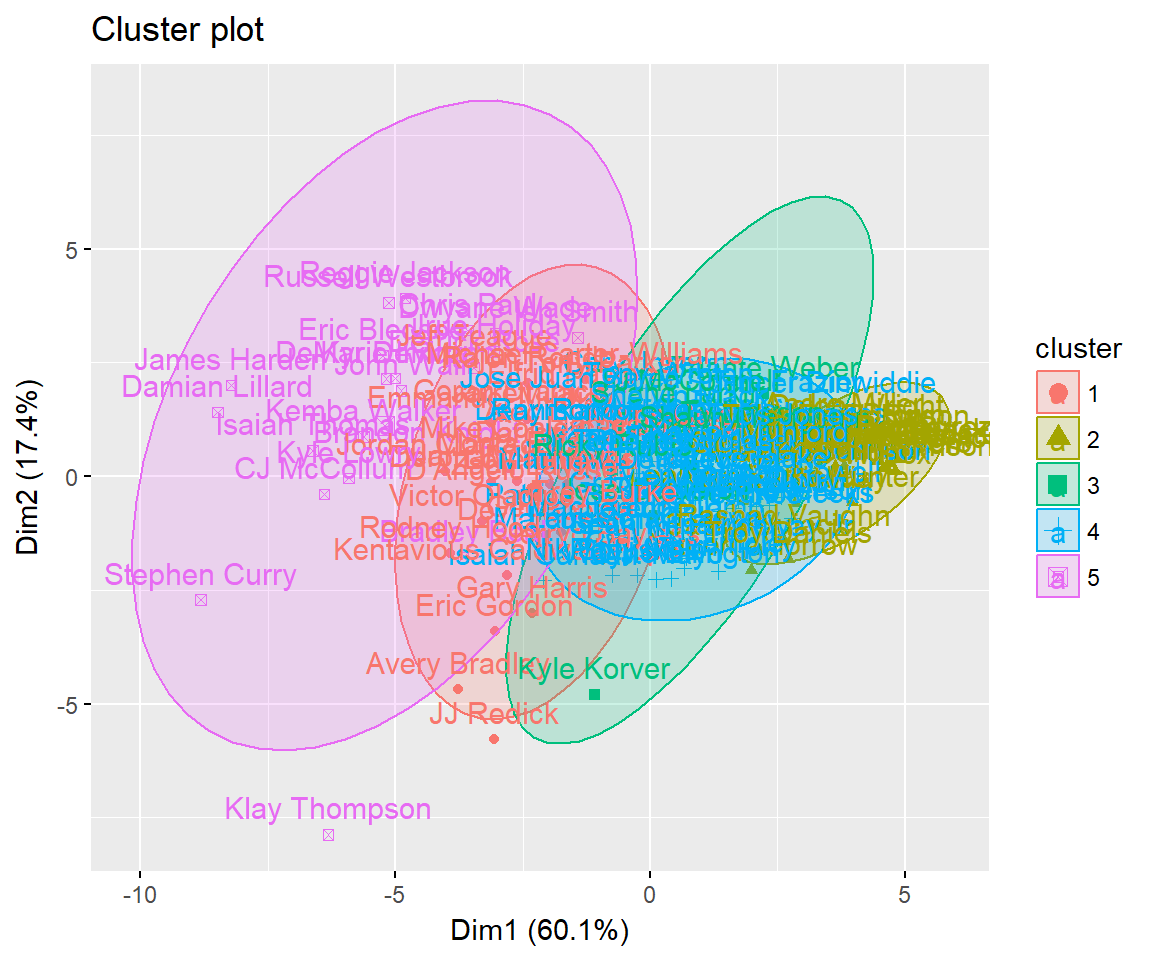
I had HUGE problem with guards because when you look into the data they look basically the same, but as you watch the game, everyone of them plays different. It took me a lot of time to pick up sufficient attributes for dividing guards into sensible groups. In fact it is the main reason I added playtypes data to the model.
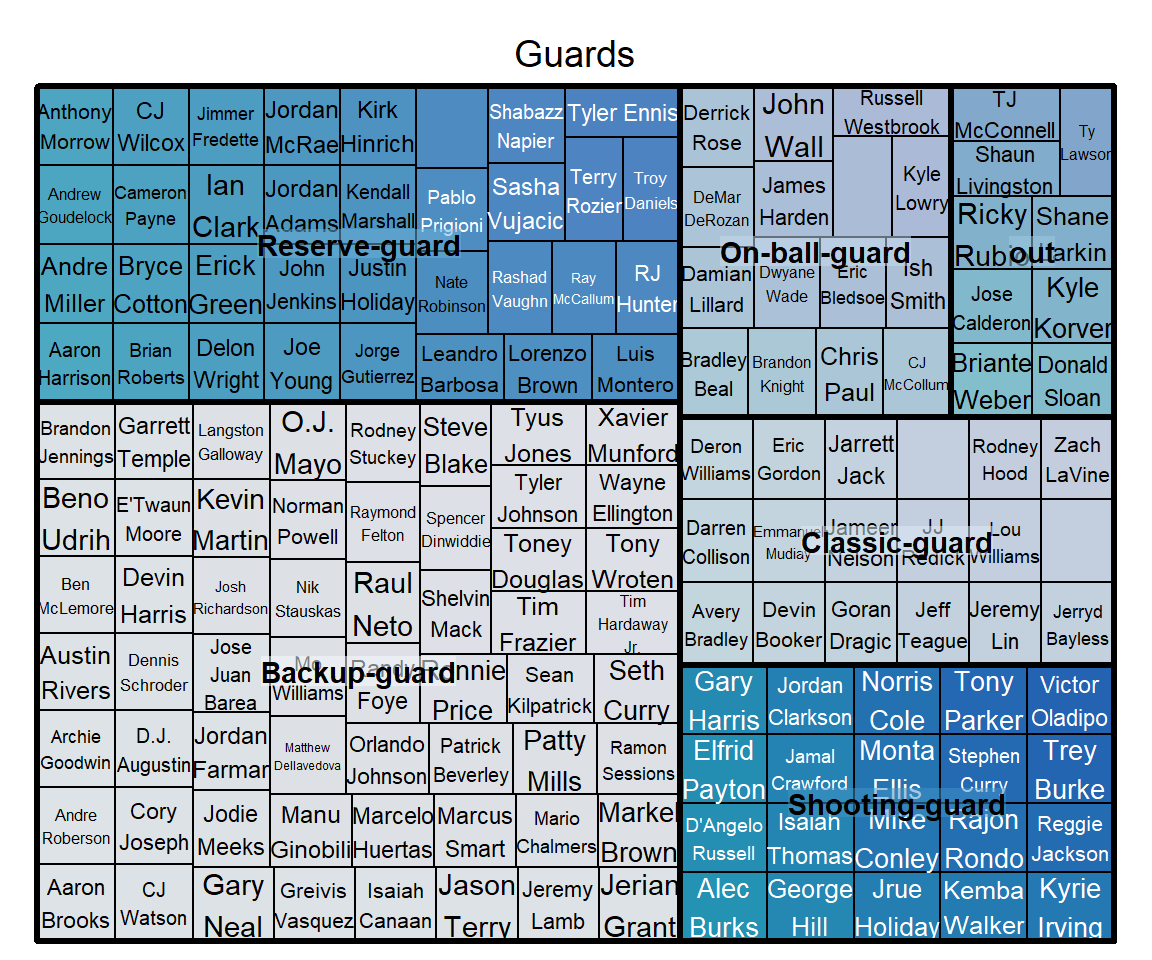
On the next page you can find a treemap with all the players in one chart.
