DBSCAN approach to finding outliers among players
Although DBSCAN creates clusters on big and noticeably divided datasets I use it here mainly to find outliers among all players. That means it would distinguish all-stars players or those on the other side of NBA rankings. Luckily, it was the first one.
library(factoextra)
library(fpc)
library(readr)
library(dplyr)
library(tidyr)
library(tibble)

players <- read_rds("../../data/dbscan/players.RDS") %>%
  remove_rownames() %>%
  column_to_rownames(var = 'PLAYER_NAME')

dbs <- fpc::dbscan(players, eps = 4 ,MinPts = 200, scale= TRUE, method = 'raw')
fviz_cluster(dbs, players, stand = FALSE, ellipse = FALSE, geom = "text",labelsize = 5) +
  theme_bw() +
theme(legend.position="none") 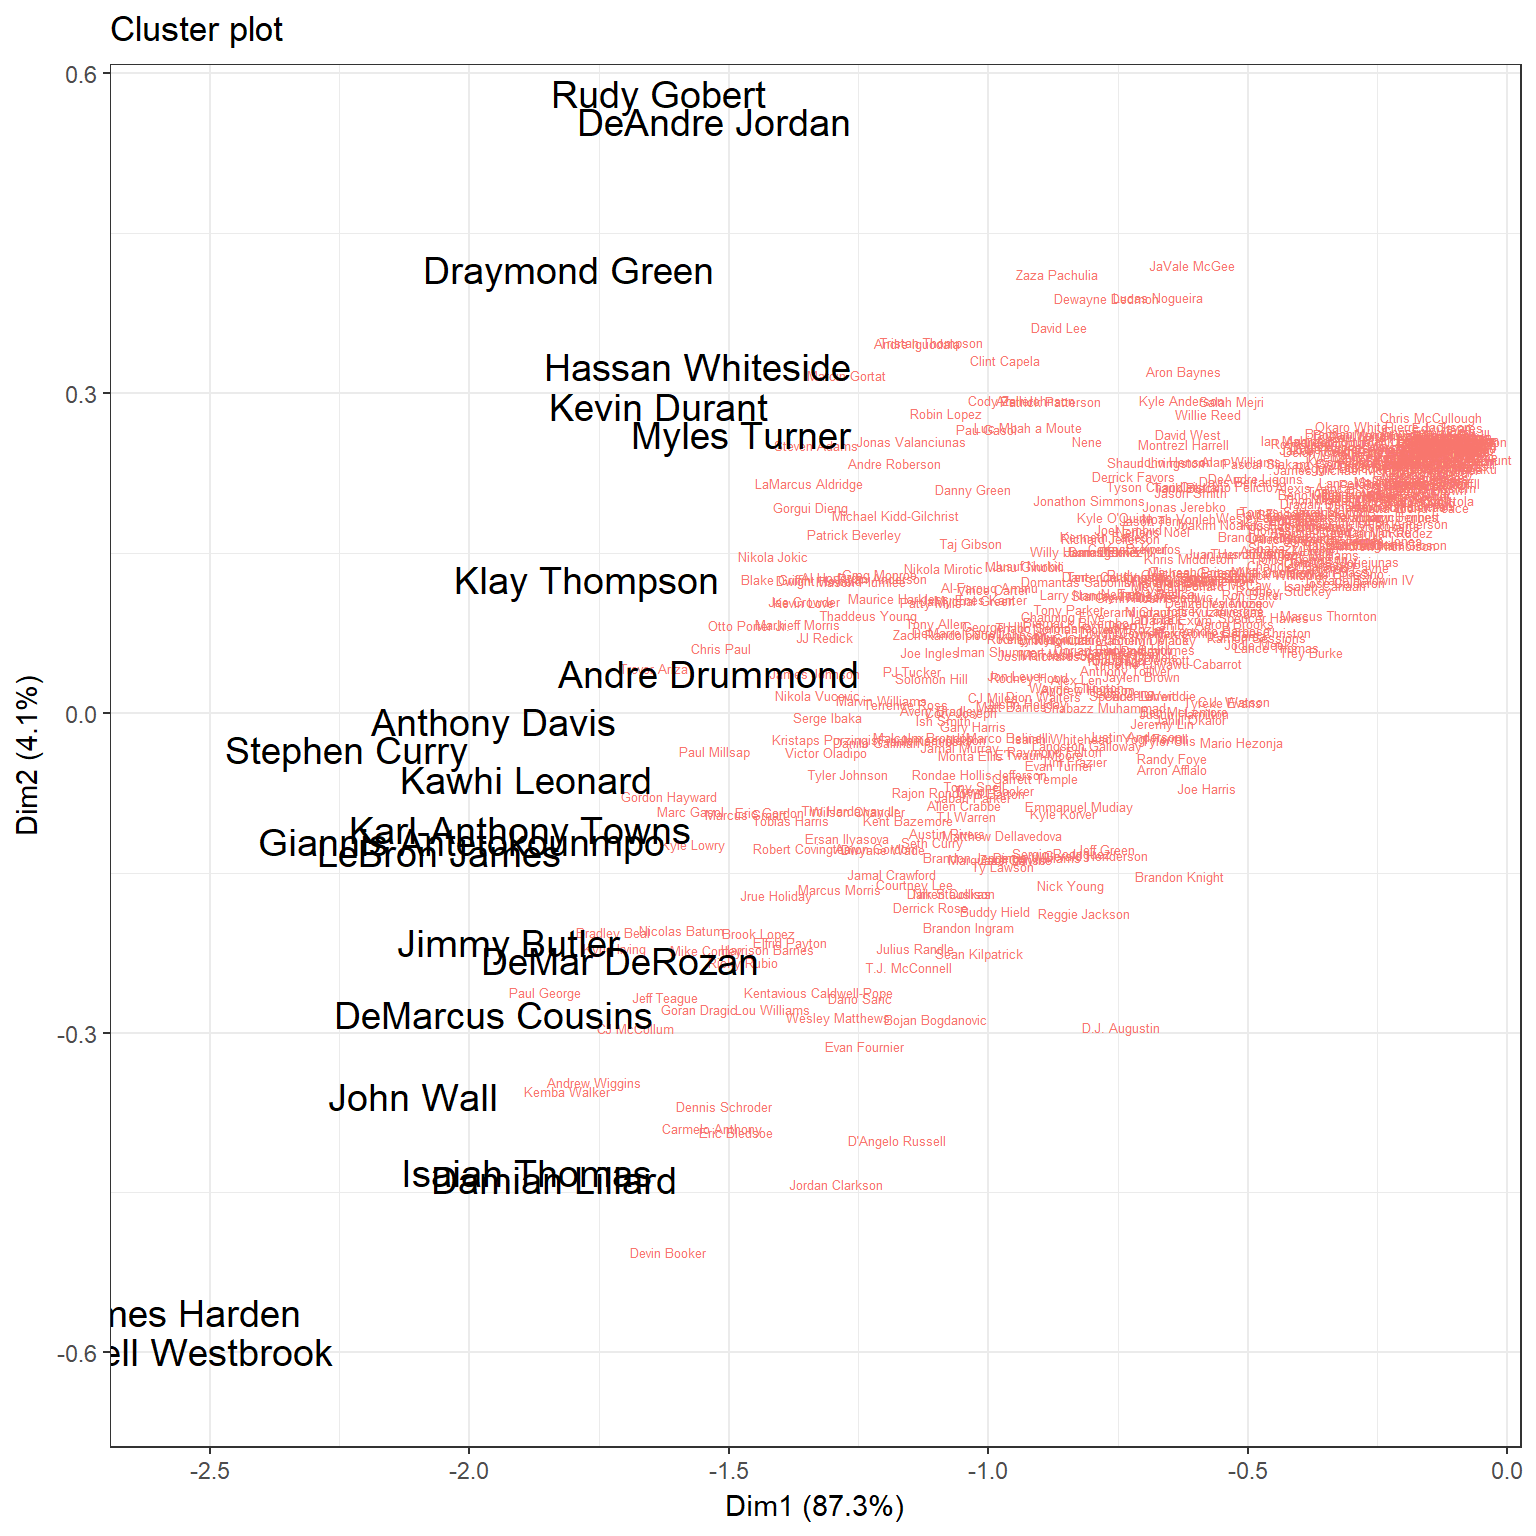
So it worked fantastic in highlighting players who stand out among the field in one way or another. And thats it for now. I am going to find out one day, how to exploit full capabilities of DBSCAN algorithm.
To create a cluster and a plot I used packages fpc and factoextra (based on ggplot2).