Cavaliers - Warriors offense-defense analysis
Lets try to predict what will happen in NBA finals. On one side - uber team with perennial all stars, 2 of top3 NBA players, 3 of top10, 4 of top15. Golden State is a monster. They can shoot from anywhere, contested or not, pull up, spot up, you name it. On defense they switch on screens in the blink of an eye, with every member of their death lineup able to guard almost all positions (Curry will not guard frontcourt guys). Bad day? Dray acting like an idiot? Curry cold and Klay asleep? No matter, KD can win single games on its own. They are walking fire, they are pouring rain, they are monsters, warriors.
On the other side we got LeBron James, greatest of all time. Just overpassed MJ in scored points in playoffs, its his 8th trip to the finals, lost 4 times - in 2007 he was not even supposed to be there, he lost miserably to Mavs in 2011, answered in 2012 by whooping OKC kids, repeated in 2013 by beating mighty Spurs, against whom lost the rematch next year - when Spurs were probably the best ball moving teams in te history. Came back to where he belong and took torn apart by injuries and inexperienced Cavaliers squad to the finals, where lost again with magical Warriors team…
And then he came back, like a king, winning last 3 games of 2016 finals in the best playoff series comeback ever, beating best regular season team (73 wins?!) in history 3 times in a row. In my eyes he validated his King status, maybe even his GOAT status with this ring. But he is back, stronger and better than ever, leading very well composed team with Kyrie Irving and Kevin Love playing on the all star level.
Can he beat the most talented team of all times? Can the best player win against the best team? We are going to witness something incredible. After quite predictable season and playoffs, these finals have a shot to be epic.
Being completely honest my view will be biased. Data and analysis will not. I cannot hide the fact over the years I became a huge fan of LeBron James story - I wanted him to win in 2007, then I hated him after he left Cavs in a very bad manner, and then finally I rooted for him again during’s last year finals. Today he is the only man that can stop Golden State juggernaut.
All data is scraped using NBAr package created by myself, to visualize parallel coordinates plots I used library parcoords, and to plot radar charts I needed d3radarR library. Special thanks to Kent Russel from http://buildingwidgets.com for sharing these great packages!
Golden State Warriors, predictably or not, rolled over Western Conference playoffs undefeated, playing more or less the same basketball they played all year, having similar usage for their players and making deadly pull-up shots from arena’s parking lots.
On the other hand, Cavs (Lebron) turned off their regular season cruise control, hit the switch and went berzerk (Lebron) on their Eastern Conference rivals and finished 12-1. Following plot shows Lebron’s regular season statistics lines (green) and playoff stats (orange). You can clearly see increase in points, steals, blocks, free throws attempts, plusminus, minutes played… with slight decrease in assists. No wonder they went so fast.
(Plot is called parallel coordinates)
require(parcoords)
parcoords( height = '200', width = '1000',
  cle.all[
        cle.all$PLAYER_NAME == 'LeBron James' &
          cle.all$COMMENT == '',
          c('category','PTS','REB','AST','STL','BLK','FTA','PLUS_MINUS','MINS')
          ]
  , rownames=F
  , brushMode="1d"
  , reorderable = T
  , autoresize = TRUE
  , color = list(
    colorScale = htmlwidgets::JS(sprintf(
      'd3.scale.ordinal().range(%s).domain(%s)'
      ,jsonlite::toJSON(RColorBrewer::brewer.pal(3,'Set2'))
      ,jsonlite::toJSON(as.character(unique(cle.all[,which(colnames(cle.all) == 'category')])))
    ))
    ,colorBy = 'category'
  )
)
Lets check other finals superstars:
Stephen Curry:
Kevin Durant:
Kyrie Irving:
Kevin Love:
Klay Thompson:
I chose several playtypes from stats.nba.com to compare the most and the least efficient way to score for both. I use points per possesion KPI and also opponent’s PPP in order to find any advantages for any team here. Plot below presents PPP scored by Warriors by playtype and PPP scored by Cleveland’s opponents by playtype, so you get the comparison between one team’s offence and another team’s defense per playtype.
So we are looking here for potential advantage. High playtype PPP on offensive side and high PPP on defensive side means big possible trouble for defensive side and so on.
Radar plot no.1: Warriors on offense, Cavaliers on defense:
Here you can see an advantage that Warriors may miss and these are handoffs. Cavs are definately not good at defending handoffs (1.1 Opponent’s PPP), but on the other hand, Warriors almost never use this play (gotta pull it up from 10 meters,man). The smallest difference in PPP’s is transition, which means if the pace starts increasing then Cavaliers will be in trouble. They just cant run with Warriors.
Radar plot no.2: Cavaliers on offense, Warriors on defense:
This is just a great confirmation of Warrior’s superior defense. The only indicated weakness are points after offensive rebounds which makes total sense since Warriors tend to play smallball.
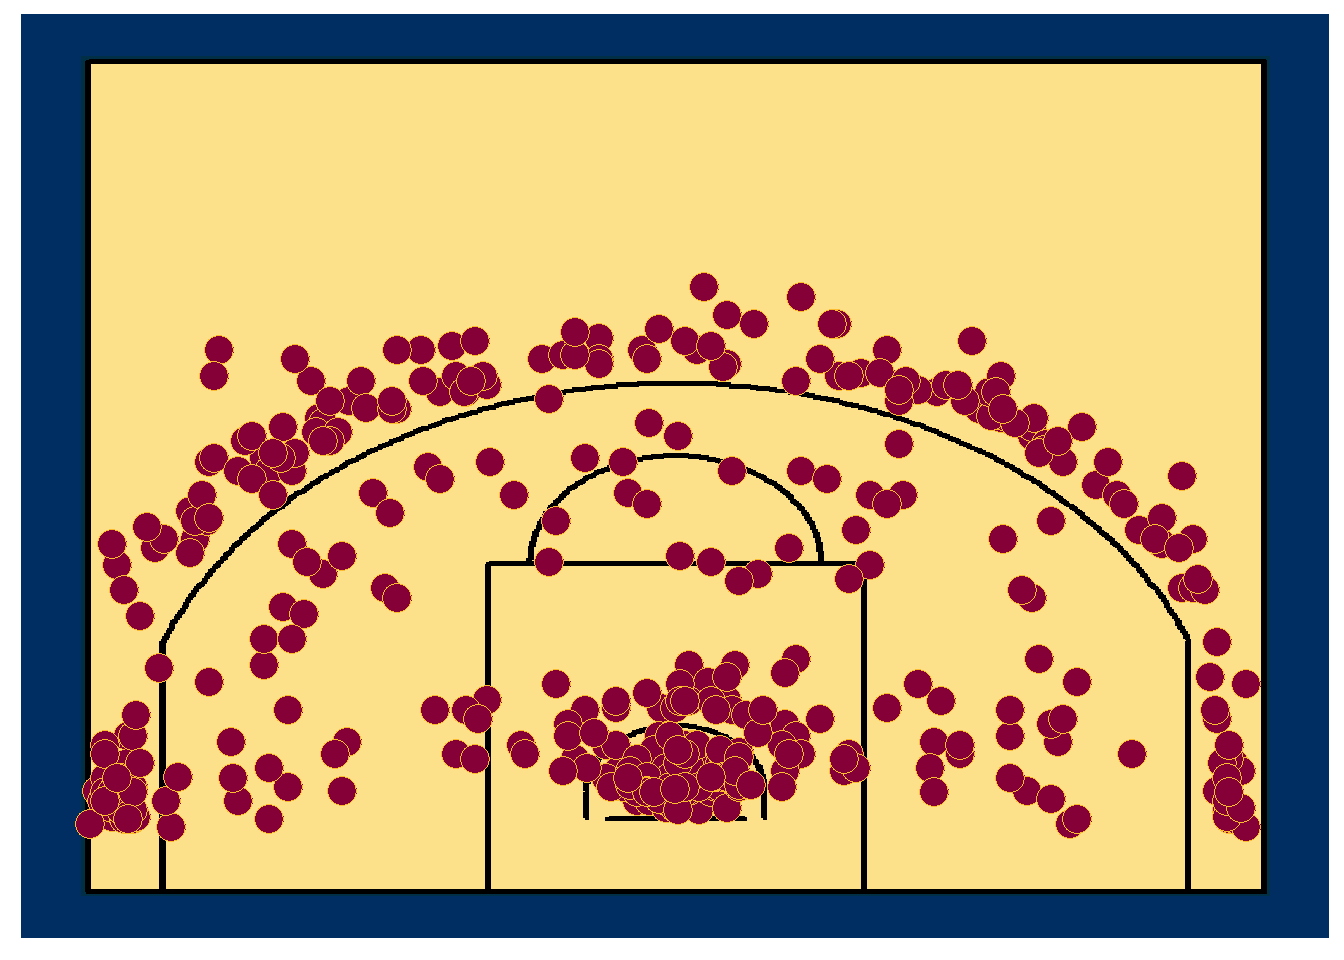
Since both teams are focused on long-distance shot I don’t really expect much difference here. Plotshots present all FGM by both teams during 2017 playoffs.
Cleveland Cavaliers:
Golden State Warriors:
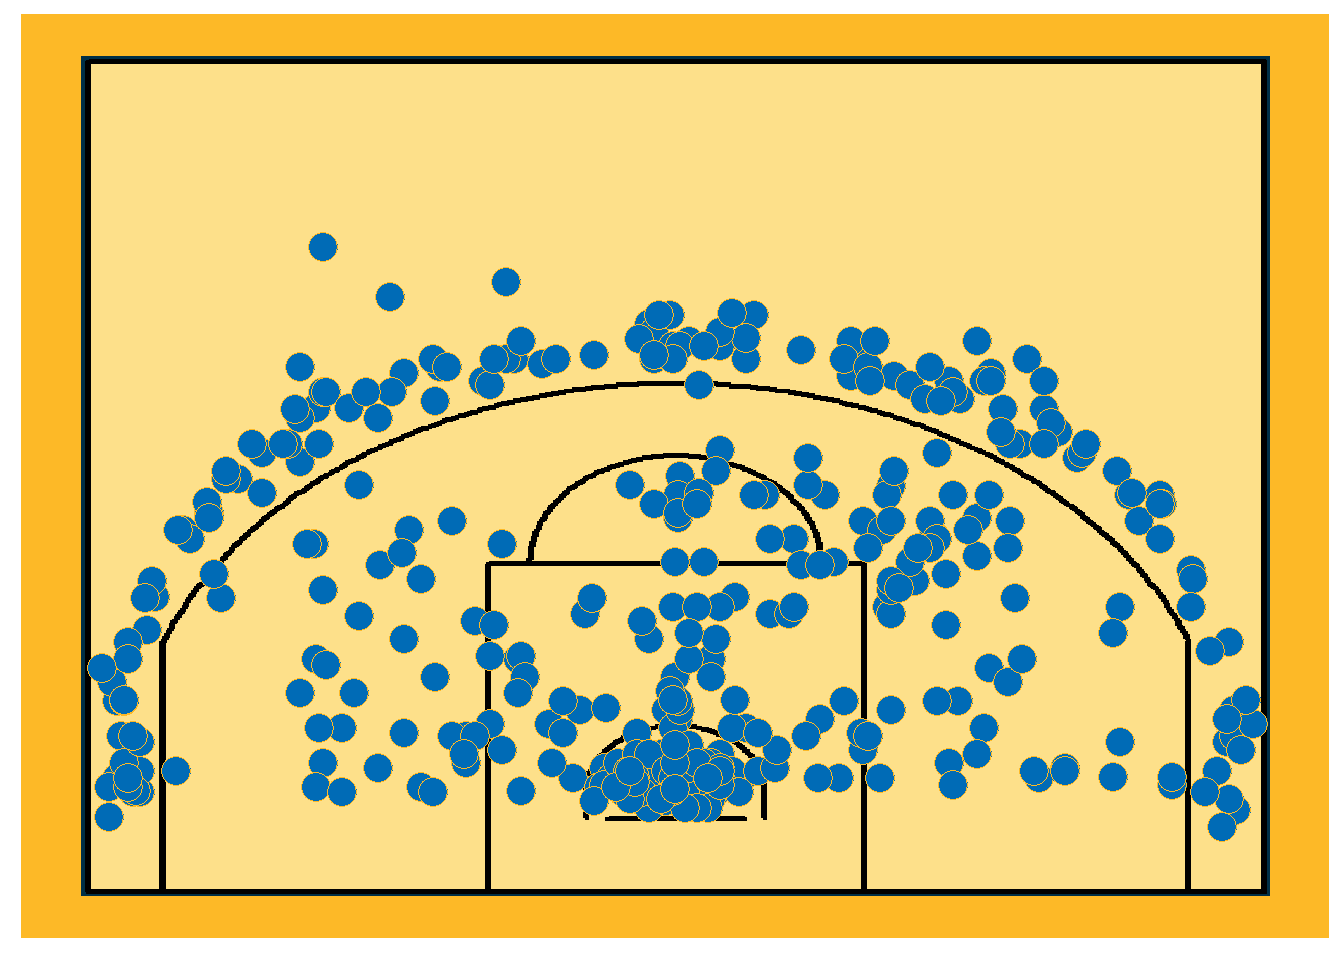
Cavs seem to have a few more corner 3 pointers and Warriors shot a bit more from midrange, but there is no big visual difference between those two, lets dig into numbers itself.
Seriously, are Warriors able to move their shooting abilities from corner to corner? They make 58% from right corner, but just 32% from left one. Cavs opponents in playoffs were making only 32% of their right corner shots and over 44% from left one.
Everything seems contained and safe for Warriors here. Once again, their defense is superior and maybe the paint might be the issue for them.
Last but not least, lets have a look if Cavaliers can find a real advantage on the boards.
Columns order wasn’t even on purpose, I was expecting flat higher line for Cleveland Cavaliers and flat lower line for Golden State Warriors. Seems like Cavs are slightly better in contesting for offensive rebounds. When we ignore contesting and focus on the basic values (OREB_PCT) it becomes clear that Cavs are better on the boards - they offensive rebound percentage is 2% higher.
This analysis was focused on finding differences between NBA finalists by comparing their offense-defense statistics. It wont tell us who win, but can indicate main advantages each team can have against their rival. Hope you enjoyed reading and feel free to give feedback.